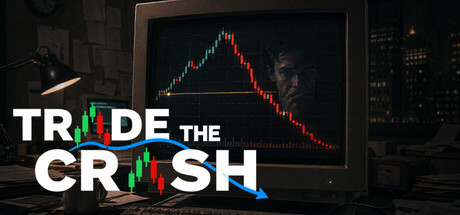
Trade the Crash
A single-player trading simulator set during the 2000 dot-com crash. Trade 63 fictionalized instruments across 818 historical market days, manage $50,000 in starting capital, pay living expenses, and try to survive the collapse.
It is February 28, 2000. You have $50,000, a family depending on you, and 818 trading days ahead.
The dot-com bubble bursts in 11 days. You do not know that yet.
Trade the Crash is a historically grounded single-player trading simulator inspired by the 2000-2003 market collapse. Choose a career path, manage capital, pay monthly living expenses, and trade through the period one candle at a time.
All company names, company-specific news, and stock symbols shown in the game are fictional. Historical market behavior is presented through fictionalized simulation instruments.
There is no undo. No speed multiplier. No second chances. One candle at a time, you live the crash.
Trade Across 63 Simulation Instruments
Choose a career archetype and trade a curated set of instruments from that asset class:
Tech Trader - fictional technology companies and broad market funds
Blue Chip Analyst - fictional industrial, consumer, healthcare, energy, and financial companies
Futures Trader - crude oil, gold, silver, natural gas, corn, wheat, and more
Forex Trader - major currency pairs
Bond Trader - short-, medium-, and long-duration government bonds
The market timeline follows the historical period while company identities and symbols remain fictional.
86 In-Game Study Hall Lessons
Trade the Crash is built as a learning environment. An integrated Study Hall teaches you as you play, covering:
Chart Reading - candlesticks, timeframes, support and resistance, volume, trends
Patterns - Head and Shoulders, Cup and Handle, Double Top/Bottom, Flags, Wedges, Triangles, and more
Indicators - RSI, MACD, Bollinger Bands, ATR, ADX, Stochastic, OBV, CCI, Williams %R, Moving Averages
Order Types - Market, Limit, Stop, Stop-Limit, Stop Loss, Take Profit
Trading Psychology - Fear, Greed, FOMO, Loss Aversion, Revenge Trading, Anchoring, Herd Mentality
Risk Management - position sizing, the bid-ask spread, P&L, drawdown
Elliott Wave Theory - a 10-lesson deep dive from basics to applying wave analysis during a market crash
Strategies - Day Trading, Swing Trading, Trend Following, Mean Reversion, Event-Driven
History - the dot-com bubble, the 2000 market peak, the decline, policy responses, and the recovery
Every lesson can be applied immediately on a live simulation chart.
Key Features
818 Trading Days - February 28, 2000 to June 2, 2003, one candle at a time
63 Simulation Instruments - fictionalized equities and funds, plus futures, forex, and bonds
5 Career Paths - each focused on a distinct asset class and perspective on the crash
86 Study Hall Lessons - integrated education covering patterns, indicators, psychology, and strategy
Realistic Market Conditions - cash trading for most assets, broker-style forex sizing and margin limits, commissions, stop loss, and take profit orders
Monthly Living Expenses - $5,000 per month deducted automatically. Survive the market and your bills.
Roguelike Save System - no rewinding and no manual saves. One run, one outcome.
Full Drawing Toolkit - trend lines, channels, Fibonacci retracements, position markers, measure tool, and more
Multiple Timeframes - 1H, 4H, 1D, 1W, and 1M chart views per instrument
Steam Leaderboards - compete for the highest return by June 2, 2003
The Stakes
You start with $50,000. You pay $5,000 per month in living expenses: rent, groceries, and bills. Three years ahead of you means $180,000 in expenses before the market gives you a single dollar back.
If your account hits zero, it is over.
The technology-heavy market will lose most of its peak value. The news will be full of false bottoms and dead-cat bounces. Every rally will feel like the recovery. Most will not be.
Your job is to figure out which is which.
Not Financial Advice
Trade the Crash is an educational simulation inspired by historical market conditions. Game performance does not predict real-market performance. This is entertainment and education, not a trading signal or financial advisory service.